
OverviewOverview
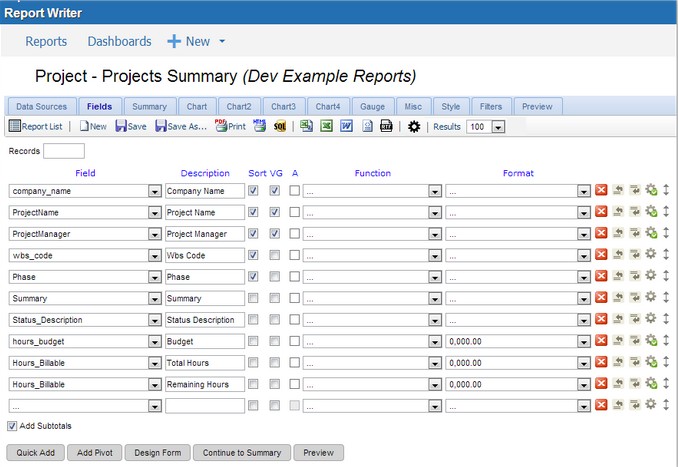
The Fields tab is where the actual report is built. This tab allows you to define which fields from your data source will be included in your report and any grouping, sorting, and totaling that needs to be performed. There are several options that are available to users from this tab. Listed below are brief descriptions of the properties available on the Fields tab.
To locate this screen navigate to System > Report Writer.
Field_Descriptions_Field Descriptions
Format_bookmark0Format
The Format drop-down is a list of available formats for the entries of the field selected in the Field drop-down. Different format options will be available depending on the selected Field data type and the function. The main two formats used will be available for all numbers and dates.
<table data-table-width="760" data-layout="default" ac:local-id="34632784-f41e-452c-9030-59aac0fed863"><colgroup><col style="width: 226.67px;"><col style="width: 226.67px;"><col style="width: 226.67px;"></colgroup><tbody><tr><td data-highlight-colour="#333333"><p><strong><span style="color: rgb(255,255,255);">Format</span></strong></p></td><td data-highlight-colour="#333333"><p><strong><span style="color: rgb(255,255,255);">Description</span></strong></p></td><td data-highlight-colour="#333333"><p><strong><span style="color: rgb(255,255,255);">Examples</span></strong></p></td></tr><tr><td><p></p><p>. . .</p></td><td><p>Displays the number as it is stored in the database</p></td><td><p></p><p>500</p></td></tr><tr><td><p>0,000</p></td><td><p>Displays as a whole number</p></td><td><p>500</p></td></tr><tr><td><p>0,000.00</p></td><td><p>Displays with two decimal places</p></td><td><p>$500.00</p></td></tr><tr><td><p></p><p>$0.00</p></td><td><p>Displays as currency with two decimal places</p></td><td><p></p><p>$500.00</p></td></tr></tbody></table> <table data-table-width="760" data-layout="default" ac:local-id="6d1a3d09-c06d-4cc0-96a6-697d4ed96df6"><colgroup><col style="width: 226.67px;"><col style="width: 226.67px;"><col style="width: 226.67px;"></colgroup><tbody><tr><td><p></p><p>$/100</p></td><td><p>Displays the Number / 100 In currency format.</p></td><td><p></p><p>$5.00</p></td></tr><tr><td><p>0.0</p></td><td><p>Displays with one decimal place</p></td><td><p>500.0</p></td></tr><tr><td><p>0.00</p></td><td><p>Displays with two decimal places</p></td><td><p>500.00</p></td></tr><tr><td><p>0.000</p></td><td><p>Displays with three decimal places</p></td><td><p>500.000</p></td></tr><tr><td><p>0%</p></td><td><p>Displays the number as a percentage</p></td><td><p>50000%</p></td></tr><tr><td><p></p><p>% of Group (with rounding)</p></td><td><p>Same as % of Group but rounds to the closest tenth (ex. 1.11547% would be 1.1%).</p></td><td><p></p><p>100.0% (only one selected value, 500)</p></td></tr><tr><td><p></p><p>% of Group</p></td><td><p>Calculates the percentage of the row value to the entire group of values.</p></td><td><p></p><p>100%</p></td></tr><tr><td><p></p><p>Gauge</p></td><td><p>Shows value in a Linear Gauge instead of a numerical value.</p></td><td><p></p></td></tr><tr><td><p></p><p></p><p></p><p>Gauge (variable)</p></td><td><p>Shows values in a Linear Gauge which changes format due to values. The field you format supplies the value to be gauged, the next two numerical fields establish (respectively) the lower and upper boundaries of the gauge.</p></td><td><p></p></td></tr><tr><td><p></p><p>Dash Gauge</p></td><td><p>Shows values in a Linear Gauge which changes format due to values.</p></td><td><p></p></td></tr></tbody></table>Group_Results_by_DateGroup Results by Date
To group results by date:
-
Navigate to System > Report Writer > New > Report.
-
Select the Data Sources you want to report on.
-
Click the Fields tab and select the fields from the drop-down.
-
For the first selected field, select one of the Group By functions available, such as Group(Year), in the
-
Function field.
-
For the second selected field, select Count in the Function field.
- Complete the report as usual.
How_to_Group_Results_by_DateHow to Group Results by Date
Watch the following video to learn about grouping results by date.
Media, iframe, embed and object tags are not supported inside of a PDF.
Create_a_Pivot_ChartCreate a Pivot Chart
To create a pivot chart:
-
Navigate to System > Report Writer > New > Report.
-
Select the Data Sources you want to report on.
-
Click the Fields tab and select the fields from the drop-down.
-
Click Add Pivot and select the column headings that will appear across the top of the chart from the Add Pivots for drop-down.
-
Complete the report as usual.
-
How_to_Create_a_Pivot_ChartHow to Create a Pivot Chart
Watch the following video to learn how to create a pivot chart for your reports.
Media, iframe, embed and object tags are not supported inside of a PDF.
Create_a_Drill_Through_ReportCreate a Drill Through Report
This feature is useful to build links into reports that connect to other reports providing additional detail. To create a drill through report:
-
Navigate to System > Report Writer and locate the existing report you would like to add a drill through.
-
Hover over the report and click edit.
-
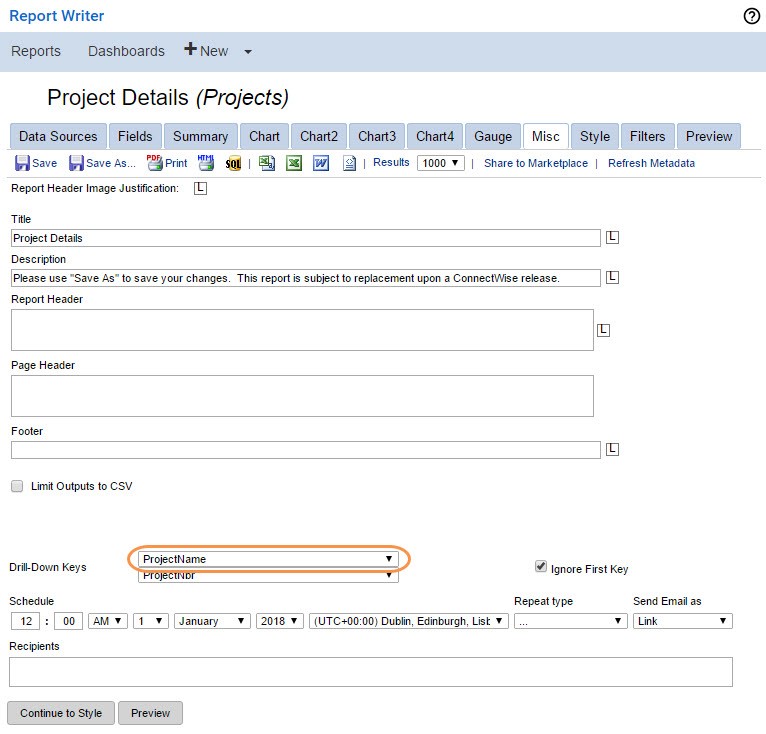
Navigate to the Misc tab.
-
-
Select Project Name from the Drill Down Key drop-down.
-
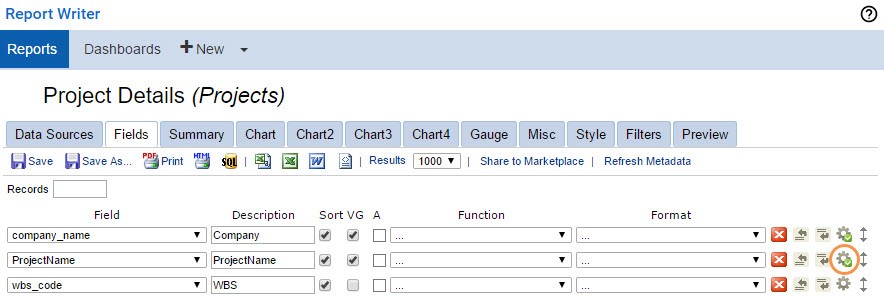
Navigate to the Fields tab.
-
Click Advanced Settings for the Project Name field. The Advanced Properties window will appear.
-
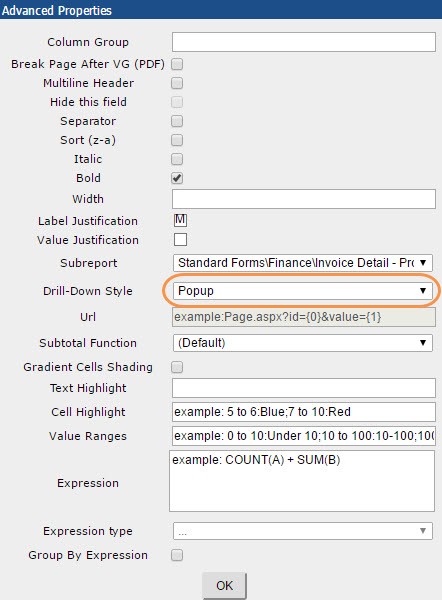
In the Subreport field, select the name of your report.
- Select Popup in the Drill Down Style drop-down.
-
Click OK.
-
Click Save.
How_to_Create_a_Drill_Through_ReportHow to Create a Drill Through Report
Watch the following video to learn how to create a drill through report.
Media, iframe, embed and object tags are not supported inside of a PDF.
Embed_a_SubreportEmbed a Subreport
Once you create a report in Report Writer, you may find that you want to embed a sub-report in the main report. The following steps outline how to embed a sub-report to the main report in Report Writer. Unlike the drill through report, a subreport will not include a link to data. The data will appear in the main report.
To embed a subreport:
-
Navigate to System > Report Writer and locate the subreport.
- Hover over the subreport and click Edit.
-
Navigate to the Misc Tab.
-
Enter a Drill-Down Key.
-
Click Save.
-
Locate the main report and hover to edit the report.
-
Navigate to the Fields Tab and add a column for the Drill-Down Key that was created on the subreport.
-
-
Click the Advanced Settings for the specified field.
- Enter the Subreport drop-down with the sub-report that you would like to embed.
-
Populate the Drill-Down Style drop-down with Embedded.
-
Select OK.
- The sub-report is now embedded in the main report. Be sure to save all changes made to the report.