
Overview
The Report Designer allows you to create new reports and modify existing reports. The designer is structured into tabs that allow you to customize various aspects of the reports you create. The following pages listed below explain how to build a report using each of the tabs, beginning with the Data Sources tab.
To locate this screen, navigate to System > Report Writer.
Build a Report
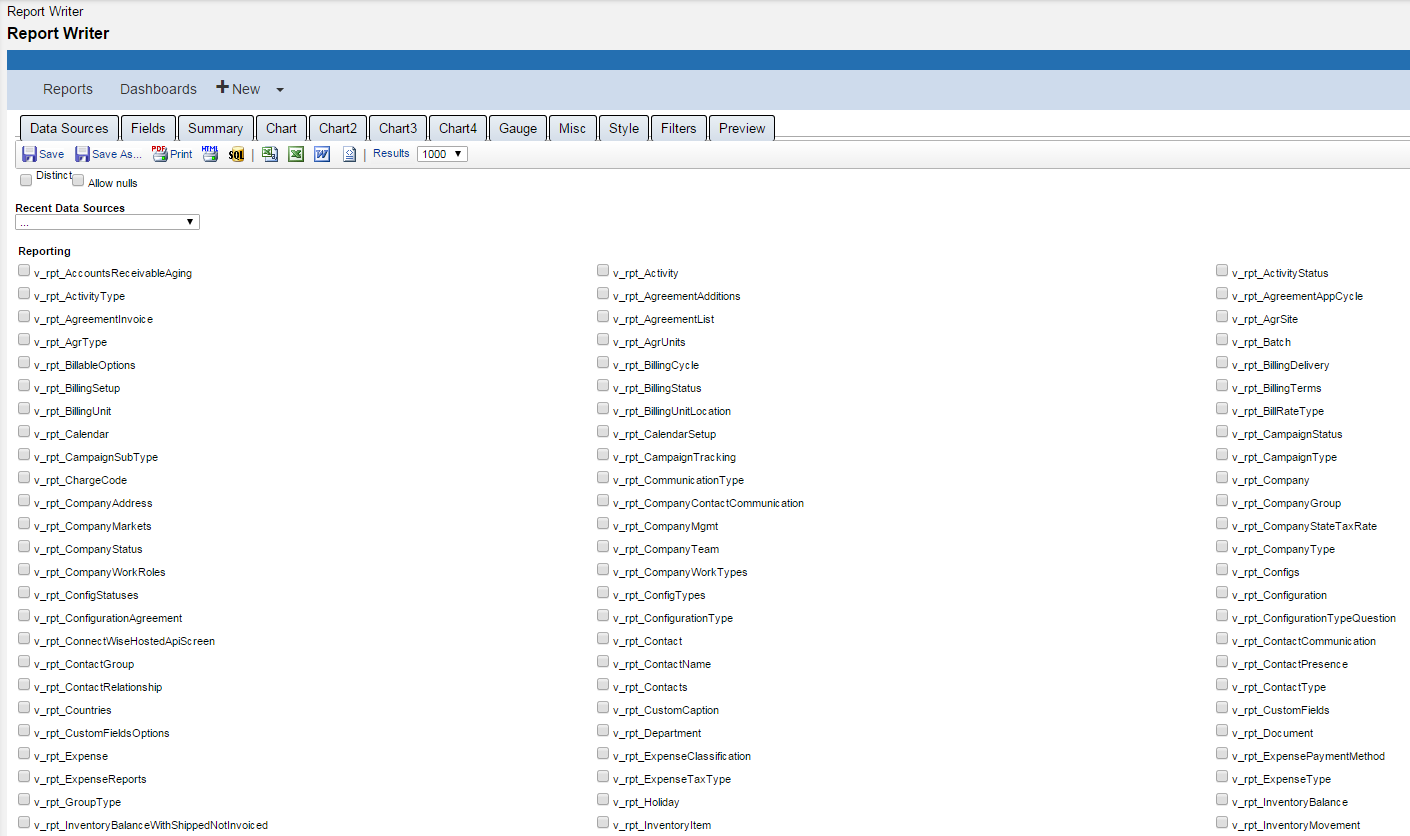
To build a report, begin by clicking New Item. You will be directed to the Data Sources tab of the Report Designer. The pages linked in the sections below explain each of the tabs and how to use them.
-
Toolbar - The toolbar allows you to modify, create and save reports, and to export your reports into various formats. It also gives you access to the settings for the Report Designer.
-
Data Sources Tab - The Data Sources tab allows you to choose what Tables or Views your report will pull data from. Your system administrator can set up the interface to simplify the data selection process, allowing for easier report creation and less time consumed trying to understand complex data models.
-
Fields Tab - The Fields tab is where the actual report is built. This tab allows you to define which fields from your data source will be included in your report and any grouping, sorting, and totaling that needs to be performed.
-
Summary Tab - In the Summary tab, a table can be created that summarizes the chosen fields using different functions. You can also make a group of fields by choosing the Group option from the Function dropdown menu.
-
Chart Tab - The Charts tab allows you to create a chart using the data in the table/view selected on the Data Sources tab. You can choose from different types of charts
-
Gauge Tab - The Gauge tab allows you to create a panel of gauges grouped by a field from your dataset.
-
Misc Tab - The Miscellaneous (Misc) tab allows you to add a title, description, header, and footer to the report. It also allows justification to be used on each of these items. This is also where the sharing and Scheduling controls are located as well as tools to create a drill-down.
-
Style Tab - The Style tab is where you can customize the look and feel of your report. You can change the color of the border, header, and rows, as well as the order of the report items.
-
Filters Tab - In the Filters tab, the fields of the table/view chosen in the Data Sources tab can be filtered so that only pertinent entries appear in the table.
-
Preview Tab - From the Preview tab, you can see how a report is generated and what it will appear visually in the report viewer before publishing it. This allows report designers to freely explore the various settings and tabs easily because of this.